
Hey,
So wedding season is over and it’s back to reality, and back to getting beat up by SQL!
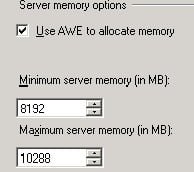
As a follow on from my last post, SQL Server 32 Bit and AWE, I wanted to cover the topic of monitoring your memory.
So as you may have noticed when you enabled it, if you look in task manager, sqlserver.exe is more than likely using a lot less memory than it was before. Great! You might say, as I did, it’s managing it’s memory so much better now, what a great result!
Wrong.
Over to Microsoft regarding AWE:
“Each instance that uses this memory; however, must statically allocate the memory it needs. SQL Server can only use this AWE allocated memory for the data cache and not for executables, drivers, DLLs, and so forth.”
(Source http://support.microsoft.com/kb/274750)
So what does this mean to us? It means that sqlsever.exe now reports memory usage only for executables, drivers, DLLs “and so forth”, and doesn’t give us an accurate figure on how much RAM it is actually using. It also means that if you have set your Max Server Memory to 8GB, it will go off and grab that and hold on ever so tight. So you can take it that whatever you’ve given it, it’s got. To take a look for yourself, run the command DBCC MEMORYSTATUS and check out the first window returned, “Memory Manager”. If it’s doing as it should, you’ll get results like the below:
Memory Manager KB
VM Reserved 2718712
VM Committed 146876
AWE Allocated 10543104
Reserved Memory 1024
Reserved Memory In Use 0
So I can see that “AWE Allocated” has grabbed the amount of RAM I told it to take.
 |
| Memory Allocated |
Ok good, so now we know it has the RAM kept aside, but it doesn’t really tell us what sort of shape our SQL instance is in. On 64 bit SQL without AWE enabled, if sqlserver.exe is using 4GB of RAM of an overall 16GB, then we can be fairly confident that we’re in good shape, SQL only needs 4GB of RAM and has plenty of room to grow. But with 32bit it’s harder to tell, because it has all of it’s RAM allocated, but doesn’t easily inform you of how much it’s actually using. Enter the Buffer Pool check.
Buffer pool check
The buffer pool at a very high level is SQL Servers data cache. This is where all the data you or your applications request gets pulled into and manipulated. If you see a lot paging or disk activity, it may be because your buffer pool doesn’t have enough room and is throwing pages out to disk. So how to check?
SELECT DB_NAME(database_id) AS [Database Name],
COUNT(*) * .0078125 AS [Cached Size (MB)],
COUNT(*) as ‘Cached Pages’
FROM sys.dm_os_buffer_descriptors
WHERE database_id > 4 — system databases
AND database_id <> 32767 — ResourceDB
GROUP BY DB_NAME(database_id)
ORDER BY [Cached Size (MB)] DESC OPTION (RECOMPILE);
The output will look something like :
Database Name Cached Size(MB) Cached Pages
BFDB 9089.6484375 1163475
ReportServer 0.2265625 29
So what does this mean? It means out of the 10GB of RAM I’ve allocated, 9GB is being used. How does that make me feel about my 10GB allocation? Not too bad actually! If I’m not seeing problems, and it’s using all of it’s available memory, that means I have a pretty optimized SQL server setup.
How do I know if I have a problem? When I start to see lots of disk thrashing as the cache starts to page out to disk. How does this slot in to your setup? I have no idea! As with most answers in SQL server, it depends. This is simply a guide to show you how much memory you are actually using when you have AWE enabled. If you have no performance problems, you’re golden, it’s just a curiosity exercise.
If you do have problems, hopefully this will let you pinpoint if it’s a RAM problem or if some rogue developer is using your server for marathon Unreal Tournament sessions.
Sorry this post ran a lot longer than I thought, so I’ll summarize it a bit!
1. With AWE enabled, Windows task manager doesn’t give you an accurate representation of how much RAM your server is using (Process explorer might do, but it can be difficult to track down what’s actually doing what)
2. With AWE enabled, it will grab all of the RAM you have told SQL it can have automatically
3. The query above will show you how much your Buffer pool (Data Cache) is using, this is the biggest memory eater in SQL server
4. If you’re not having problems and it’s using all available resources, you don’t have a problem!
This post goes into a bit more depth than I’ve gone before, but unfortunately troubleshooting SQL server isn’t always an easy process. If you have any questions or need anything clarified, as always, please don’t hesitate to contact me.
*Edit* – Typically the day I go to put out a blog post on this the super geniuses over at Brentozar.com put one out too! Here’s one with quite a bit more detail than mine on reporting memory use to the OS .
Stephen